Experiment Design Validates Measurement Technology
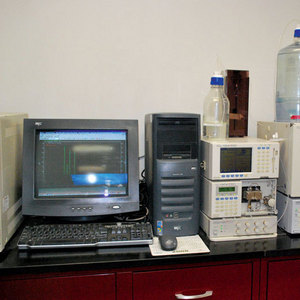
An inside look at solving the challenge of stabilizing samples and developing a new test methodology.
By Ron Stites | May 21, 2014

An industrial equipment supplier wanted to sell an existing product, which, anecdotally was found to increase ethanol yield. Before putting the device on the market, the company wanted to find the best operating conditions and determine what performance its product could deliver for ethanol producers.
The first step was finding the right measurement method and a way to preserve samples so they would not deteriorate during shipment from plant to lab. After an accurate measurement method had been identified, the next step was running a number of tests to get an idea of which factors affected sample preservation. Finally, a design of experiments (DOE) was performed that quantified the effects of these factors, singly and in combination, on sample preservation.

My company, Stites & Associates LLC, is a technology development and improvement company working in a wide variety of energy applications. The main activities include setting up labs and experiments, evaluating data, evaluating lab operations, and evaluating and improving technologies. SALLC operates a research laboratory in Brighton, Colo., that performs gas chromatography/mass spectroscopy (GC/MS), cyclic voltammetry and optical microscopy. I have found that by combining excellent analytical work with diligent research and outside-the-box thinking, it is possible to not only evaluate existing technology but to gain insight into the best ways to try to improve a technology. Often, this combination results in learning how to make nonobvious improvements that can result in real breakthroughs.

In the application discussed here, the supplier contracted with SALLC to develop a method for measuring how well its product performed. In the ethanol process, the breakdown of starch to glucose takes place in two steps, from starch to maltrodextrins and then from maltodextrins to glucose. The equipment supplier hypothesized that its product could speed up the breakdown of starch to glucose while using fewer enzymes in the preceding liquefaction and saccharification steps. The goal was also to minimize “burning,” a phenomena that occurs when shorter-chain sugars react together and with proteins to form polymers that yeast cannot digest. In fact, some are even toxic to yeast. This process is monitored by analysis of the degree of polymerization (DP) of the maltodextrins, a measurement that can be challenging. The main difficulty is that the analysis requires specialized techniques that are not available in most ethanol plants, so samples must be sent to a lab. The samples are not stable, however, so the breakdown of starch continues during transport.

We needed to find a way to stop the reaction for 72 hours while the sample was shipped for testing. Even samples from the actual production process were too inconsistent to use for developing the sample preservation process. I found that spray-dried maltodextrin provides a consistent starting material to evaluate methods of stopping the reaction. I researched the enzymes and found they did not work well at low pH and low temperatures, so I lowered the pH by adding sulfuric acid, cooled the samples and held them for simulated shipping times of 24 to 72 hours before testing. A pH of 2 appeared to prevent the enzymes from working. I reviewed published literature and found a new method based on high performance liquid chromatography (HPLC) that could accurately measure maltodextrins. After setting up equipment in the SALLC lab, we confirmed the HPLC method easily detected changes in sugar concentration (see Figure 1).

With this preliminary work out of the way, the actual DOE was relatively simple. I was familiar with Design-Expert software from Stat-Ease Inc., Minneapolis, Minn., having been director of research for Range Fuels, but I am an experimenter not a statistician.  Design-Expert fits my needs because it is designed for use by subject matter experts who are not necessarily experts in statistical methods. The software walks users through the process of designing and running the experiment and evaluating the results. Stat-Ease also provides very good support. I contact them not only for questions about using the software, but also to check out my statistical thinking and they have always been very helpful.
The factors, runs and results for the DOE are shown in Table 1. The Response 1 column, “%<DP9,” shows the sample at the start of the experiment at 25 percent and increasing during the experiment. The results show that pH is the most important factor and that the other factors all had minimal effects, although incubation at 60 degrees Celsius made things slightly worse by speeding up the reaction. The best results were provided by pH adjustment to 2.0 and storage at 3 C with the DP increasing to only 25.04 percent after 48 hours. This is less than the standard deviation of the HPLC method and this method can be easily performed in the field.

Next, I addressed the question of whether these results are significant or could have been achieved by chance. Factorial design analysis uses the half-normal plot to identify significant effects. The orange and blue rectangles on the half-normal plot in Figure 2 show the effects, positive and negative respectively, and the position of these rectangles reflect the relative size. The further the factor effects are from the line near zero, the more likely they are to be significant. In this case, the factor effects of variable A, which is pH, are much greater than the variation between the insignificant effects, demonstrating the statistical significance of the experiment.

The method for Run 6 was selected and worked very well from the beginning for samples from the slurry and liquefaction steps. Some strange results were seen with fermentation samples—most of the carbohydrates were gone. It was discovered that the sulfuric acid was interfering with the HPLC measurements. The method was modified to remove the sulfuric acid before analysis by treatment with barium hydroxide and filtering. Since this modification was made, the method has worked with samples from all three process steps.

Hundreds of samples were shipped from ethanol plants around the Midwest and used to evaluate the performance of the new product. Some plants found significantly better results and others did not see significant improvements. The product is still under development and the jury is still out. However, the DOE was clearly successful in its ability to identify and validate a measurement method that has enabled us to accurately evaluate the performance of the new product in a large number of plants under a wide range of operating conditions.

Author: Ron Stites,
Managing Member, Stites & Associates LLC
912-247-6120
[email protected]