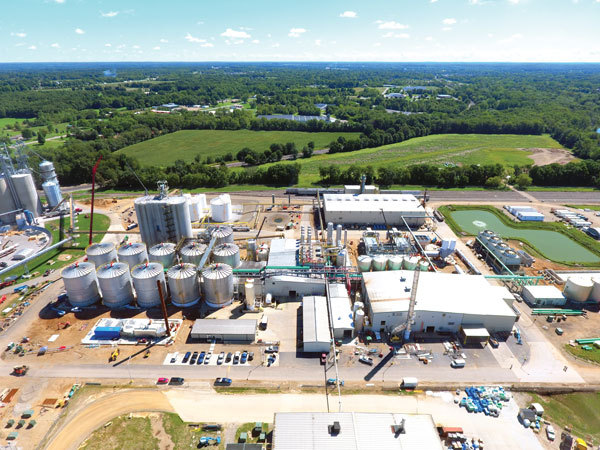
PHOTO: MARQUIS ENERGY
May 19, 2017
BY Susanne Retka Schill
The number to beat to be named an efficient ethanol producer is 20 percent. Under the 2007 Energy Independence and Security Act, existing ethanol plants, plus those under construction and completed by the deadline, were grandfathered into the Renewable Fuel Standard. Any expansions or new construction were required by statute to meet a threshold of a 20 percent greenhouse gas (GHG) reduction compared to the baseline gasoline fuel.
Ten years later, 75 plants have achieved efficient producer status, which includes the one greenfield plant built since the RFS rule went into effect—Dakota Spirit AgEnergy in North Dakota. Any proposed ethanol plant must show its GHG emissions profile meets the threshold before EPA will permit it to generate renewable identification numbers (RINs). There are three that have been approved, including two corn-ethanol plants, Elite Octane in Iowa and Ringneck Energy & Feed in South Dakota, and one using barley, Montana Advanced Biofuels.
For the U.S. EPA, a corn ethanol plant’s greenhouse gas emissions profile boils down to four numbers representing the mass and energy balances of an ethanol plant—bushels of corn ground, gallons of ethanol produced, cubic feet of natural gas and kilowatt hours of electricity consumed. The inputs and outputs are plugged into an EPA formula to calculate the GHG reduction—a formula based on the modeling done in 2010 that found the typical U.S. corn ethanol dry mill, using natural gas and producing 100 percent DDGS, had a 16.8 percent GHG reduction compared to the 2005 baseline value of gasoline.
The ethanol industry asserts that the decade-old formula needs updating. The 2010 model includes the controversial international indirect land use penalty, estimated in the rule at 32 kgCO2e/MMBtu. Another 12 kg was added for net international agriculture emissions without land use change. The international GHG penalty totals just over half of the 82 kgCO2e/MMBtu emissions assigned to corn ethanol. In the EPA’s GHG tool developed for the efficient producer petition process (EP3), the complex modeling done for the 2010 rule was reduced to a single emission factor for corn upstream GHG emissions: Each bushel of corn (measured at 15.5 percent moisture) gets multiplied by 9.73 kgCO2e. Industry advocates point to more updated studies and modeling that would ratchet down the international GHG penalties, not to mention the improved life-cycle emissions for corn production in the U.S. from higher yields and more efficient fertilizer rates.
Most of the 75 plants that submitted their data and were approved as efficient producers reduced GHG between 20 and 23 percent, as shown in the accompanying bar chart. The roughly dozen plants at 24 percent or better GHG reductions—the highest being 34.4 percent—are primarily located in areas where a big portion of their distillers grains are going out as wet cake or modified distillers to nearby feeders, with the resulting drastic reduction in energy use for drying DDGS. Some plants have adopted various energy-efficient technologies. All plants can separately meter and exclude energy not used in the process, such as the electricity used in the administration building or natural gas used to dry incoming corn.
The median GHG reduction of 21.4 reflects a significant improvement of nearly 5 points above the 16.8 percent GHG reduction for the average corn ethanol plant modeled by the EPA. In the 2010 RFS rule, for example, the EPA used an ethanol yield of 2.71 gallons of ethanol per bushel of corn in its models. Today’s average yield is estimated to be 2.83 or better, and some producers report hitting yields just under 3 gallons per bushel—significant increases that make a big impact in the GHG modeling for upstream emissions from feedstock production and transport. While those improved ethanol yields and energy efficiencies are reflected in the efficient producers’ individual GHG reduction numbers, there still is that rather hefty GHG penalty for international impacts.
Capacity Creep
Getting efficient producer status opens the way for plants to expand capacity above the grandfather volumes they registered when the 2010 RFS rule went into effect. Absolute Energy was the first to get its petition approved in February 2013, before the streamlined EP3 process was created. The motivation was to expand, Absolute president Rick Schwarck says. Then at 110 MMgy, the plant could only go 5 percent over its registered volume. Today, Absolute lists a capacity of 125 MMgy. Of all those on EPA's pathway list, only three have launched big expansions to date. Marquis Energy, Hennepin, Illinois, doubled its capacity, building a south unit adjacent to its original plant, which came online in January 2016 to reach a new capacity of 300 MMgy.
The Andersons was another company that moved quickly, announcing plans in the quarterly investor call that followed the EPA determination letter. The Andersons doubled capacity at its Albion, Michigan, plant to 130 MMgy. Construction was completed in March and a company spokesman reports it has been operating beyond guaranteed capacity since then.
Little Sioux Corn Processors in Marcus, Iowa, didn’t double capacity, but it made a big leap from 92 MMgy before getting efficient producer status to 135 MMgy. General manager Steve Roe says that by summer, the plant will be running at 150 MMgy. LSCP actually had room for growth before getting the EP3 letter, he added, explaining they had registered 126 MMgy gallons as its grandfathered volume.
Most expansions among the 75 efficient producers have been more modest 5 to 10 MMgy incremental increases. The majority of producers in the group are not reporting changed capacity, however, according to an analysis of Ethanol Producer Magazine plant data. Plant capacities from the spring 2014 map were compared to this spring’s map and roughly 40 had not increased their reported capacities. In updating plant data for the most recent map, a handful of facilities on the list reported plans to increase capacities between 10 MMgy and 25 MMgy.
In comparing the capacities reported this year to those from spring 2014, 494 million gallons have been added since the inception of EP3, which includes just 65 MMgy from the one greenfield plant built in the past decade. Capacity as reported in the plant maps, however, is not a definitive number. When plants are called for updates, some report current run-rates, others prefer to keep the actual number confidential and report nameplate or another, lower capacity than maximum run-rate. Energy Information Agency fuel ethanol production data, another indicator of capacity, shows 14.31 billion gallons produced in 2014 and 15.33 billion in 2016, an increase of 1.02 billion. Run-rates are variable, of course, with recent market conditions favoring maximized throughput resulting in record production volumes this past year.
Record Keeping Requirement
Being cleared to expand capacity above the grandfathered amount registered with the EPA is a big plus. The down side is that it comes with additional recordkeeping. To be able to generate RINs for the added gallons, EPA requires plants to keep records showing their daily rolling average GHG reductions meet the threshold of 20 percent or better.
“Getting the efficient producer status is the easy part,” Roe says. “Getting the monitoring plan approved is a different story.” As one of the first plants to get EP3 approval, it took about six months to work with EPA to get the plan approved. LSCP added density metering equipment to get accurate daily measurements for corn consumption and ethanol production. Used in the refining industry, density meters were not common in the ethanol industry until the past three years, Roe says. Previous methods for measuring daily corn and ethanol data were not as accurate as the new equipment, and EPA would not allow a plant to go back at the end of the month and adjust the numbers based on inventory. Data for the daily records at LSCP is gathered at 9 a.m., Roe says, simply because that’s the time the natural gas supplier reads the meter. Electric meter readings, corn crushed and ethanol production data is recorded at the same time. Since LSCP set up its system, Roe adds, other monitoring equipment has been introduced to the industry, offering other options.
It is important to maintain the rolling daily average at 20.1 or better, Roe says. Any gallons surpassing the grandfathered volume cannot generate a RIN unless it meets the GHG reduction threshold. While EPA starts over Jan.1 counting the grandfathered volume first, the challenge of keeping that rolling daily average on target for when that is surpassed means the plant may as well maintain it year-round, he says.
Author: Susanne Retka Schill
Managing Editor, Ethanol Producer Magazine
sretkaschill@bbiinternational.com
701-738-4922
Advertisement
Advertisement
U.S. fuel ethanol production was up 2% the week ending April 18, according to date released by the U.S. Energy Information Administration on April 23. Weekly ending stocks of fuel ethanol were down 5% and exports were down 45%.
A bill currently pending in the California legislature would authorize the use of E15 within the state until state agencies complete the required evaluation process for the fuel blend and issue a decision.
The Renewable Fuels Association on April 23 thanked 25 members of the House of Representatives who sent a bipartisan letter to President Trump urging his administration to allow unimpeded sales of lower-cost E15 through the summer months.
CARB on April 4 released a third set of proposed changes to the state’s LCFS. More than 80 public comments were filed ahead of an April 21 deadline, including those filed by representatives of the ethanol, biobased diesel and biogas industries.
The Oregon Department of Environmental Quality on April 18 proposed to delay the 2024 annual report deadline for the state’s Clean Fuels Program due to a cyberattack and extended outage of the Oregon Fuels Reporting System.